Radial Charts API
This API can be used to generate 'radial' charts with 1—4 categories; text labels (including the % for category) are required, and optionally icons can be added.
The API allows for creating new charts and retrieving ones that have previously been created. Additionally a cheat sheet can be downloaded showing all available icons. See the API documentation for details of the available methods.
Example Chart
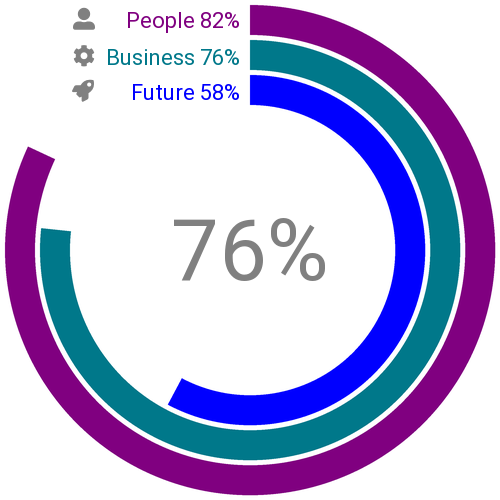
This was generated by POSTing the following data to the /chart endpoint:
{
    'items': [
        {'percent': 82.0, 'color': 'purple', 'name': 'People', 'icon': 'f406', 'icon_color': 'gray'},
        {'percent': 76.9, 'color': '#00788a', 'name': 'Business', 'icon': 'f013', 'icon_color': 'gray'},
        {'percent': 58.0, 'color': 'blue', 'name': 'Future', 'icon': 'f135', 'icon_color': 'gray'}
    ],
    'center': {
        'value': 76.0,
        'color': 'gray'
    },
    'bg_color': 'white'
}